
Page 13 - Ovarian Cancer Surgery - Quality Indicators
P. 13
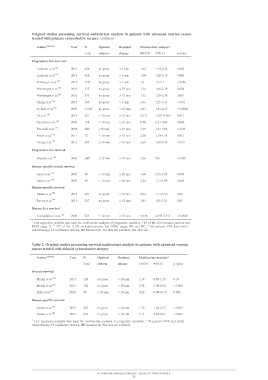
Original studies presenting survival multivariate analysis in patients with advanced ovarian cancer
treated with primary cytoreductive surgery continued
Authorreference Year N Optimal Residual Multivariate analysis*
Total criteria disease HR/OR 95% CI
p-value
Progression-free survival 2013 428 no gross ≤ 5 mm 1.64 1.19-2.26 0.002
2013 428 no gross > 5 mm 1.80 1.20-2.70 0.005
Landrum et al.161 2012 2261 no gross > 1 mm 1.6 1.3-2.1 < 0.001
Landrum et al.161 2010 573 no gross ≤ 10 mm 1.51 1.05-2.19 0.028
Polterauer et al.162 2010 573 no gross > 10 mm 1.82 1.28-2.59 0.001
Wimberger et al.163 2012 189 no gross > 1 mm 2.03 1.25-3.31 < 0.01
Wimberger et al.163 2009 3,1262 no gross ≤ 10 mm 2.03 1.81-2.27 < 0.0001
Chang et al.164 2014 251 < 10 mm ≥ 10 mm 2.371 1.221-4.606 0.011
du Bois et al.165 2009 118 < 10 mm ≥ 10 mm 0.50 0.31-0.80 0.004
Fu et al.167 2009 200 <10 mm ≥ 10 mm 1.91 1.21-3.03 < 0.05
Gerestein et al.168 2011 75 ≤ 10 mm > 10 mm 2.30 1.19-4.45 0.013
Pecorelli et al.175 2012 203 ≤ 10 mm > 10 mm 2.61 1.58-4.29 < 0.01
Abaid et al.170
Chang et al.171
Progression-free interval
Everett et al.176 2006 2003 ≤ 10 mm > 10 mm 2.96 NA < 0.001
Disease-specific overall survival
Aletti et al.177 2007 49 < 10 mm ≤ 20 mm 1.40 0.55-2.87 0.049
Aletti et al.177 2007 49
< 10 mm > 20 mm 2.56 1.13-5.99 0.049
Disease-specific survival
Rutten et al.184 2015 227 no gross < 10 mm 2.04 1.11-3.76 0.02
Rutten et al.184 2015 227 no gross > 10 mm 1.84 1.05-3.21 0.03
Disease-free survival
Kumpulainen et al.178 2009 234 ≤ 10 mm > 10 mm 4.446 2.497-7.917 < 0.0001
* Cox regression analysis was used for multivariate analyses of prognostic variables, 1 15 of the 226 included patients had
FIGO stage II, 2 277 of the 3,126 included patients had FIGO stages IIB and IIC, 3 98 patients 49% had initial
chemotherapy, CI confidence interval, HR hazard ratio, NA data not available, OR odd ratio.
Table 2. Original studies presenting survival multivariate analysis in patients with advanced ovarian
cancer treated with delayed cytoreductive surgery
Authorreference Year N Optimal Residual Multivariate analysis*
Total criteria disease
HR/OR 95% CI p-value
Overall survival 2013 124 no gross < 10 mm 1.39 0.89-2.19 0.14
Muraji et al.206 2013 124 no gross > 10 mm 3.78 2.06-6.94 < 0.001
Muraji et al.206
Bilici et al.205 2010 52 < 10 mm > 10 mm 0.28 0.003-0.37 0.002
Disease-specific survival
Rutten et al.184 2015 462 no gross < 10 mm 1.79 1.26-2.53 < 0.001
Rutten et al.184 2015 462 no gross > 10 mm 3.11 2.01-4.81 < 0.001
* Cox regression analysis was used for multivariate analyses of prognostic variables, 1 98 patients 49% had initial
chemotherapy, CI confidence interval, HR hazard ratio, NA data not available.
OVARIAN CANCER SURGERY - QUALITY INDICATORS
13