
Page 19 - Ovarian Cancer Surgery - Quality Indicators
P. 19
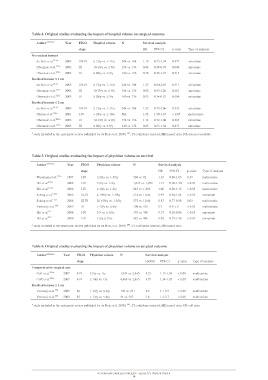
Table 4. Original studies evaluating the impact of hospital volume on surgical outcome
Authorreference Year FIGO Hospital volume N Survival analysis
stage HR 95% CI
p-value Type of analysis
No residual tumour 2005 IIB-IV ≥ 12/y vs. 1-11/y 244 vs. 108 1.19 0.73-1.94 0.477 univariate
du Bois et al.211,a 2003 III 10-19/y vs. ≤ 9/y 154 vs. 176 0.46 0.28-0.78 0.004 univariate
Obermair et al.223,a 2003 III ≥ 20/y vs. ≤ 9/y 140 vs. 176 0.78 0.48-1.27 0.313 univariate
Obermair et al.223,a
Residual tumour ≤ 1 cm
du Bois et al.211,a 2005 IIB-IV ≥ 12/y vs. 1-11/y 244 vs. 108 1.27 0.80-2.01 0.311 univariate
III 10-19/y vs. ≤ 9/y 154 vs. 176 0.82 0.53-1.26 0.361 univariate
Obermair et al.223,a 2003 III ≥ 20/y vs. ≤ 9/y 140 vs. 176 0.53 0.34-0.83 0.006 univariate
Obermair et al.223,a 2003
Residual tumour ≤ 2 cm
du Bois et al.211,a 2005 IIB-IV ≥ 12/y vs. 1-11/y 244 vs. 108 1.27 0.78-2.06 0.333 univariate
I-IV > 10/y vs. ≤ 10/y NA 1.92 1.90-1.94 < 0.05 multivariate
Olaitan et al.224,a 2001 III 10-19/y vs. ≤ 9/y 154 vs. 176 1.14 0.72-1.80 0.585 univariate
III ≥ 20/y vs. ≤ 9/y 140 vs. 176 0.85 0.53-1.34 0.473 univariate
Obermair et al.223,a 2003
Obermair et al.223,a 2003
a study included in the systematic review published by du Bois et al. 2009) 209, CI confidence interval, HR hazard ratio, NA data not available.
Table 5. Original studies evaluating the impact of physician volume on survival
Authorreference Year FIGO Physician volume N Survival analysis
stage HR 95% CI
Woodman et al.225,a 1997 I-IV ≥ 6/2y vs. 1-5/2y 504 vs. 92 1.19 0.86-1.65 p-value Type of analysis
Elit et al.210,a 2002 I-IV 3-9/y vs. 1-2/y 1,017 vs. 1,292 1.13 0.98-1.30 0.37 multivariate
Elit et al.210,a 2002 I-IV ≥ 10/y vs. 1-2/y 843 vs. 1,292 1.00 0.86-1.15 > 0.05 multivariate
Schrag et al.112,a 2006 III-IV 4-19/8y vs. 1-3/8y 614 vs. 1,044 0.93 0.84-1.04 > 0.05 multivariate
Schrag et al.112,a 2006 III-IV 20-61/8y vs. 1.3/8y 573 vs. 1,044 0.87 0.77-0.98 > 0.05 univariate
Vernooij et al.220 2009 III > 12/y vs. ≤ 6/y 100 vs. 510 0.7 0.5-1.0 0.03 multivariate
Elit et al.217 2008 I-IV 3-9 vs. ≥ 10/y 403 vs. 496 0.73 0.62-0.86 > 0.05 multivariate
Elit et al.217 2008 I-IV 1-2/y ≥ 10/y 425 vs. 496 0.92 0.79-1.06 < 0.05 univariate
> 0.05 univariate
a study included in the systematic review published by du Bois et al. 2009) 209, CI confidence interval, HR hazard ratio.
Table 6. Original studies evaluating the impact of physician volume on surgical outcome
Authorreference Year FIGO Physician volume N Survival analysis
stage HR/OR 95% CI p-value Type of analysis
Comprehensive surgical care I-IV 2-9/y vs. 1/y
I-IV ≥ 10/y vs. 1/y
Goff et al.227,a 2007 1,944 vs. 2,165 1.35 1.15-1.58 < 0.05 multivariate
III 7-12/y vs. ≤ 6/y 4,468 vs. 2,165 1.57 1.34-1.85 < 0.05 multivariate
Goff et al.227,a 2007 III > 12/y vs. ≤ 6/y
Residual tumour ≤ 1 cm 192 vs. 217 1.6 1.1-2.5 < 0.05 multivariate
Vernooij et al.220 2009
Vernooij et al.220 2009 44 vs. 217 2.8 1.4-5.7 < 0.05 multivariate
a study included in the systematic review published by du Bois et al. 2009) 209, CI confidence interval, HR hazard ratio, OR odd ratio.
OVARIAN CANCER SURGERY - QUALITY INDICATORS
19