
Page 23 - Ovarian Cancer Surgery - Quality Indicators
P. 23
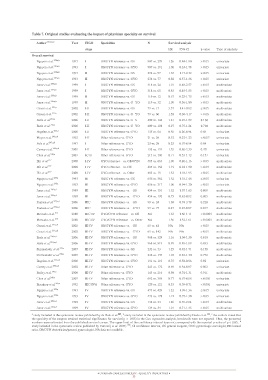
Table 7. Original studies evaluating the impact of physician specialty on survival
Authorreference Year FIGO Specialties N Survival analysis
stage HR 95% CI p-value Type of analysis
Overall survival 1993 I OB/GYN reference vs. GS 907 vs. 279 1.26 0.84-1.90 > 0.05 univariate
Nguyen et al.238,a,b 1993 907 vs. 191 1.06 0.63-1.78 > 0.05 univariate
Nguyen et al.238,a,b 1993 I OB/GYN reference vs. GYO 274 vs. 97 1.65 1.17-2.32 ≤ 0.05 univariate
Nguyen et al.238,a,b 1993 274 vs. 77 0.88 0.57-1.36 > 0.05 univariate
Nguyen et al.238,a,b 1999 II OB/GYN reference vs. GS 318 vs. 24 1.01 0.40-2.57 > 0.05 multivariate
Junor et al.229,a,b 1999 318 vs. 68 0.83 0.45-1.55 > 0.05 multivariate
Junor et al.229,a,b 1999 II OB/GYN reference vs. GYO 119 vs. 12 0.67 0.25-1.75 > 0.05 multivariate
Junor et al.229,a,b 1999 119 vs. 32 1.00 0.56-1.80 > 0.05 multivariate
Junor et al.229,a,b 2002 I OB/GYN reference vs. GS 79 vs. 17 3.57 1.41-9.02 ≤ 0.05 multivariate
Grossi et al.231,a 2002 79 vs. 60 1.58 0.60-4.17 > 0.05 multivariate
Grossi et al.231,a 2006 I OB/GYN reference vs. GYO 409 vs. 144 1.21 0.93-1.59 0.160 multivariate
Earle et al.234,a 2006 409 vs. 198 0.97 0.75-1.24 0.788 multivariate
Earle et al.234,a 2006 II OB/GYN reference vs. GS 135 vs. 64 0.50 0.26-0.94 0.03 univariate
Engelen et al.233,a 1992 21 vs. 26 0.52 0.22-1.23 < 0.05c univariate
Mayer et al.246,a,b 1997 II OB/GYN reference vs. G YO 25 vs. 29 0.25 0.07-0.94 0.04 univariate
Puls et al.247,a,b 2002 195 vs. 124 1.29 0.69-2.39 0.421 univariate
Carney et al.230,a,b 2007 I-II OB/GYN reference vs. GS 211 vs. 100 0.77 0.53-1.12 0.157 univariate
Chan et al.240,a 2008 485 vs. 664 1.00 0.86-1.16 > 0.05 multivariate
Elit et al.217 2008 I-II OB/GYN reference vs. G YO 485 vs. 158 1.19 0.94-1.50 > 0.05 multivariate
Elit et al.217 2008 485 vs. 15 1.52 1.18-1.95 < 0.05 multivariate
Elit et al.217 1993 I-II OB/GYN reference vs. G S 656 vs. 382 1.32 1.18-1.48 ≤ 0.05 univariate
Nguyen et al.238,a 1993 656 vs. 317 1.06 0.94-1.20 > 0.05 univariate
Nguyen et al.238,a 1999 I-II OB/GYN reference vs. G YO 454 vs. 151 1.32 1.07-1.63 0.009 multivariate
Junor et al.229,a,d 1999 454 vs. 192 0.75 0.62-0.92 0.005 multivariate
Junor et al.229,a,d 2006 I-II OB/GYN reference vs. GYO 99 vs. 24 1.68 0.74-3.79 0.220 multivariate
Paulsen et al.237,a,d 2006 99 vs. 75 0.47 0.25-0.87 0.017 multivariate
Paulsen et al.237,a,d 2010 I-II Other reference vs. GYO NA 1.63 1.56-1.71 < 0.0001 multivariate
Mercado et al.215 2010 NA 1.56 1.52-1.61 < 0.0001 multivariate
Mercado et al.215 2002 I Other reference vs. GYO 65 vs. 44 NA NA > 0.05 multivariate
Grossi et al.231,a,d 2002 65 vs. 142 NA NA > 0.05 multivariate
Grossi et al.231,a,d 2006 I-II Other reference vs. GYO 968 vs. 529 1.16 1.04-1.30 0.010 multivariate
Earle et al.234,a,d 2006 968 vs. 819 0.99 0.89-1.09 0.833 multivariate
Earle et al.234,a,d 2007 IC-II Other reference vs. GYO 232 vs. 53 1.25 0.92-1.71 0.158 multivariate
Skirnisdottir et al.239,a 2007 232 vs. 137 1.03 0.83-1.30 0.772 multivariate
Skirnisdottir et al.239,a 2006 I-IV GYO reference vs. OB/GYN 191 vs. 119 0.75 0.58-0.96 0.02 univariate
Engelen et al.233,a,d 2002 243 vs. 172 0.69 0.54-0.87 0.002 univariate
Carney et al.230,a,d 2006 I-IV GYO reference vs. GS 145 vs. 216 0.98 0.74-1.31 0.911 multivariate
Bailey et al.242,a 2007 692 vs. 398 0.77 0.67-0.88 < 0.001 univariate
Chan et al.240,a 1992 I-IV GYO reference vs. Other 129 vs. 121 0.53 0.39-0.71 < 0.001 univariate
Eisenkop et al.241,a 1993 473 vs. 429 1.22 1.09-1.36 ≤ 0.05 univariate
Nguyen et al.238,a 1993 III OB/GYN reference vs. GS 473 vs. 178 1.12 0.97-1.30 > 0.05 univariate
Nguyen et al.238,a 1999 134 vs. 23 1.26 0.78-2.04 > 0.05 multivariate
Junor et al.229,a,d 1999 III OB/GYN reference vs. GYO 134 vs. 54 1.01 0.71-1.45 > 0.05 multivariate
Junor et al.229,a,d
III OB/GYN reference vs. GS
III OB/GYN reference vs. GYO
IIIC OB/GYN reference vs. GS
IIIC OB/GYN reference vs. GYO
IIIC-IV GYO/GYN reference vs. GS
IIIC-IV GYO/GYN reference vs. Other
III-IV OB/GYN reference vs. GS
III-IV OB/GYN reference vs. GYO
III-IV OB/GYN reference vs. GS
III-IV OB/GYN reference vs. GYO
III-IV OB/GYN reference vs. GS
III-IV OB/GYN reference vs. GYO
III-IV OB/GYN reference vs. GYO
III-IV Other reference vs. GYO
III-IV Other reference vs. GYO
III-IV Other reference vs. GYO
IIIC-IVA Other reference vs. GYO
IV OB/GYN reference vs. GS
IV OB/GYN reference vs. GYO
IV OB/GYN reference vs. GS
IV OB/GYN reference vs. GYO
a study included in the systematic review published by du Bois et al.209, b study included in the systematic review published by Giede et al.248, c the authors stated that
the specialty of the surgeon attained statistical significance for survival p < 0.05) in the Cox regression analysis, but details were not reported. Thus, the presented
numbers were estimated from the published survival curves. The upper limit of the confidence interval does not correspond with the reported p-value of p < 0.05, d
study included in the systematic review published by Vernooij et al. 2007) 228, CI confidence interval, GS general surgeon, GYO gynecologic oncologist, HR hazard
ratio, OB/GYN obstetrician/general gynecologist, NA data not available.
OVARIAN CANCER SURGERY - QUALITY INDICATORS
23